
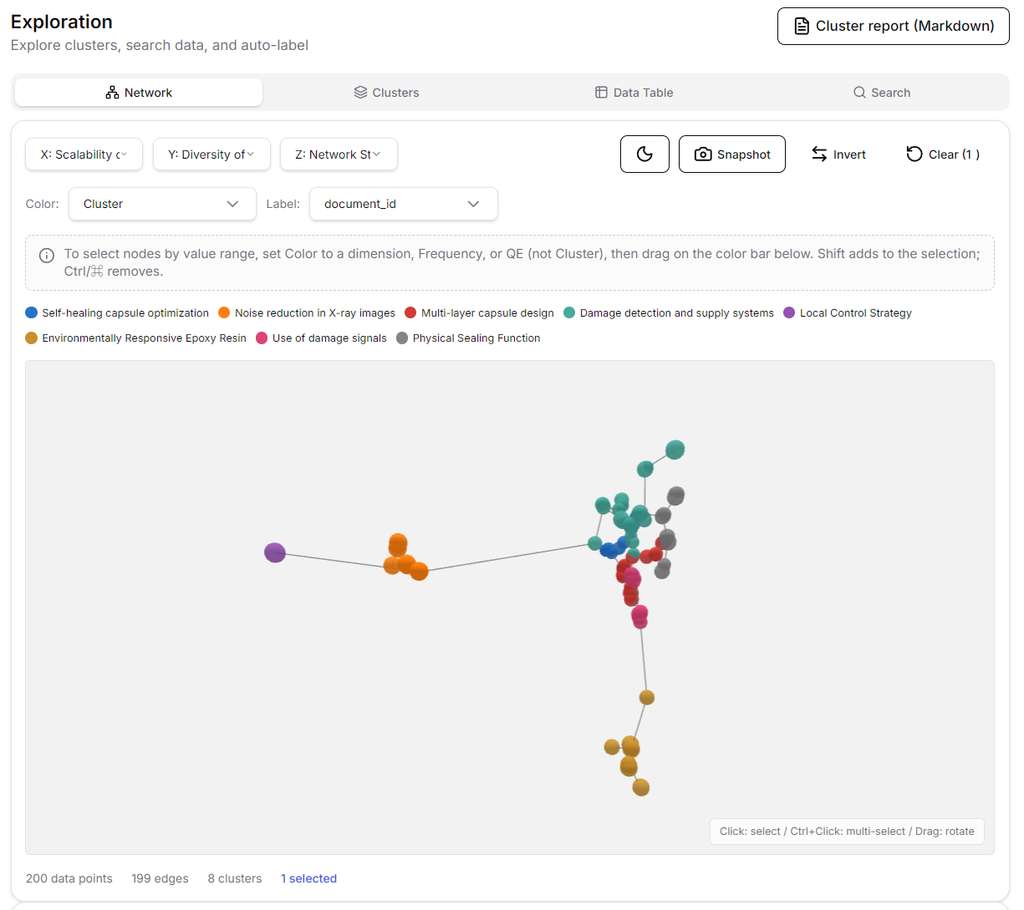
Once ConceptMiner R&D has generated numerous R&D themes, hypotheses, and candidates for cross-disciplinary applications, these can be mined to create a concept map. A concept map is a model consisting of a network of interconnected nodes. Although these nodes are situated within a high-dimensional semantic space, they are visualized by extracting key dimensions. The edges connecting the nodes represent the primary relationships (topology) between them. Each node corresponds to similar ideas—such as themes, hypotheses, or application concepts—thereby modeling the similarities and semantic connections among the ideas.
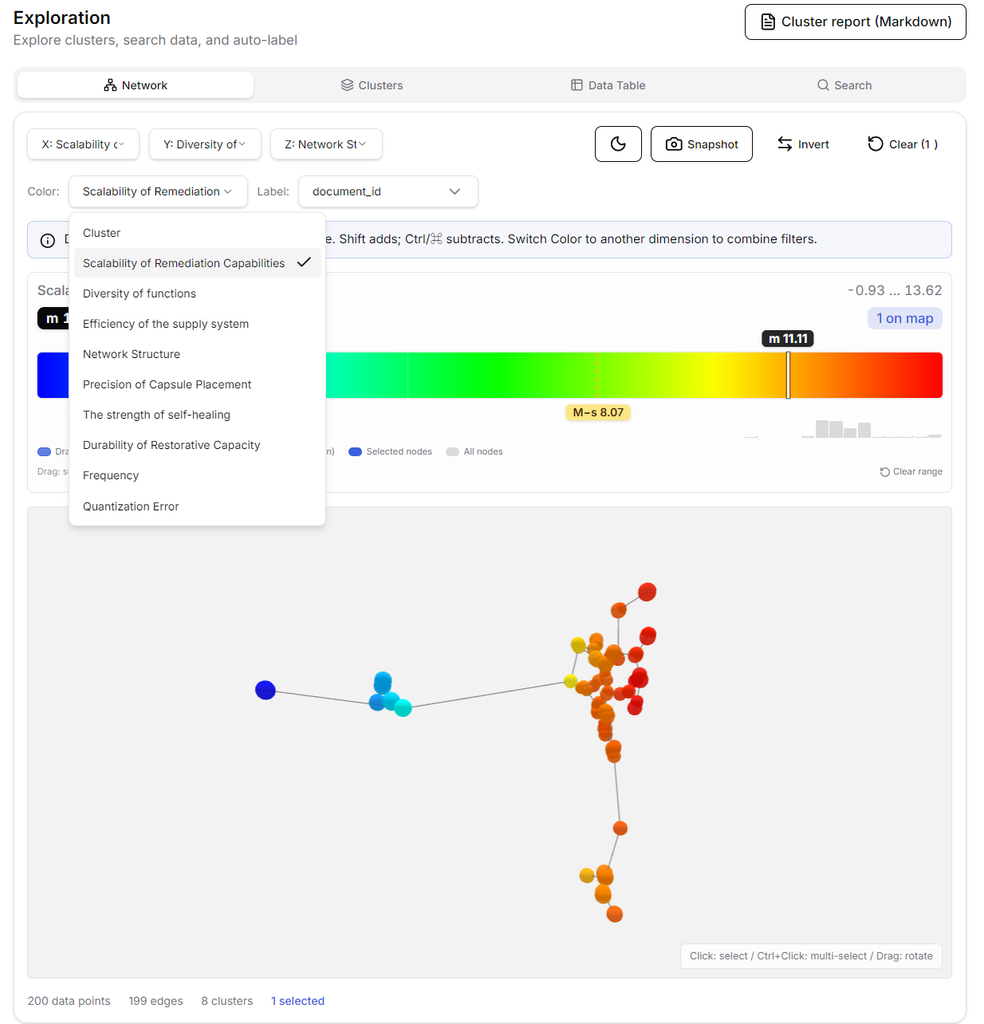
Clicking the “Color” selection field allows you to change how the nodes are colored. By default, they are colored based on “Cluster.” Key interpreted dimensions are listed under “Cluster”; selecting one of these colors the nodes according to the intensity of the characteristics represented by that dimension. This enables you to identify trends in different parts of the network.
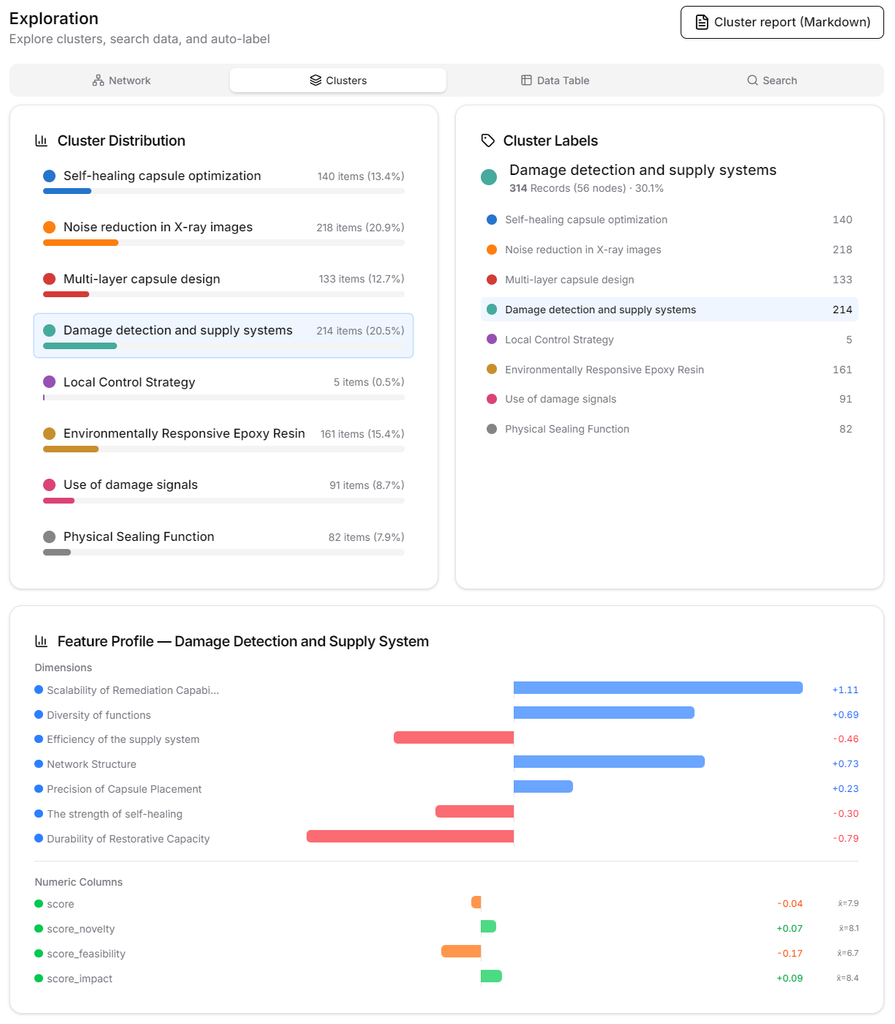
Switching to the Cluster tab allows you to view the characteristics of each cluster. When you select any cluster, its statistical characteristics are displayed in a graph.
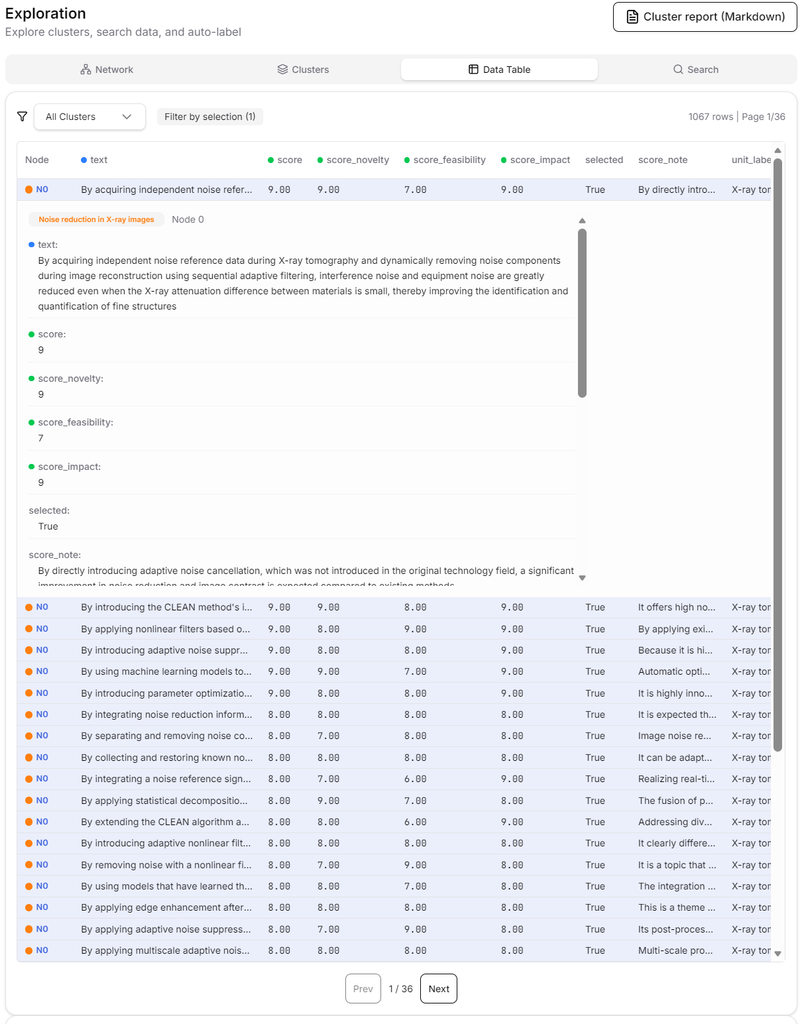
The Data Table tab allows you to access individual ideas. Since the same node contains similar ideas, you should be able to use them to plan experiments and development efficiently.
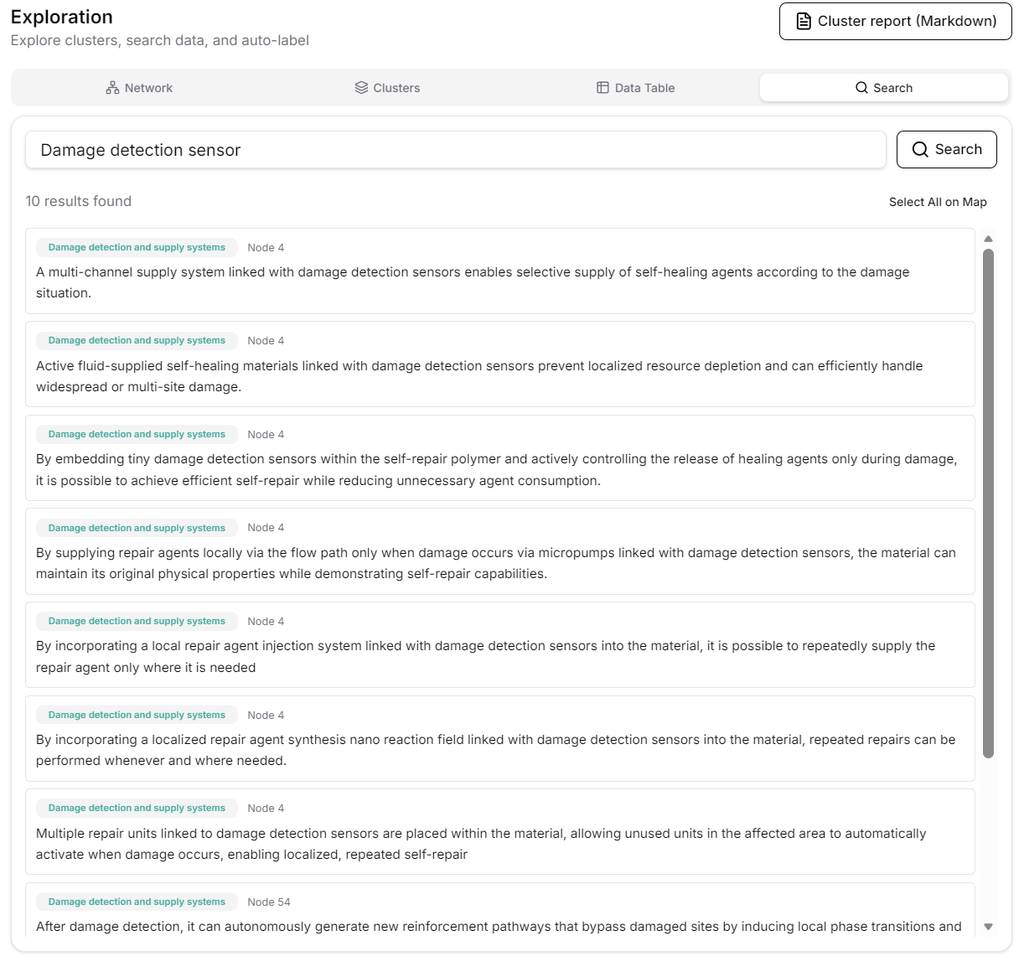
In the Search tab, you can enter keywords of interest to quickly locate nodes containing those keywords.
While numerous other analysis functions are included, the ability to efficiently extract key ideas—along with similar ones—serves the purposes of theme exploration, hypothesis generation, and the search for cross-domain applications.